
How to Assess a Wind Turbine Supplier’s Future Capacity Expansion?
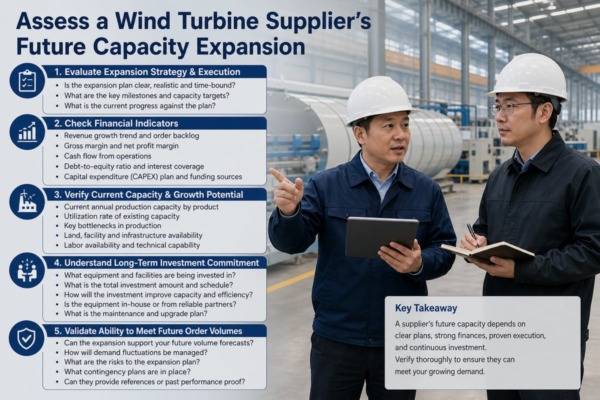
A wind turbine supplier’s future capacity expansion can make or break your project pipeline. I run an export factory in Zhejiang, and I’ve watched capacity promises collapse under real orders.
To assess a wind turbine supplier’s future capacity expansion, verify current output by product line, audit factory floor space and equipment, check funded capital expenditure plans, analyze order backlog coverage, and confirm the expansion timeline, technology roadmap, and regional footprint match your future order volumes.
The stakes are real. Rystad Energy warned that Europe could hit a turbine manufacturing bottleneck as early as 2026. If your supplier cannot scale, your projects stall. Below, I break the assessment into four practical questions. Each one comes with checks you can run yourself.
What Financial Indicators Should I Check Before Trusting a Supplier's Expansion Plans?
Last year, a US distributor asked to see our equipment invoices before doubling her order with us. She was right to ask. Money proves plans; words do not.
Check the supplier's liquidity, debt-to-equity ratio, free cash flow, and committed capital expenditure before trusting expansion plans. Factory construction takes years, so verify the balance sheet can fund multi-year builds and confirm announced capex is tied to specific budgets, sites, and timelines.
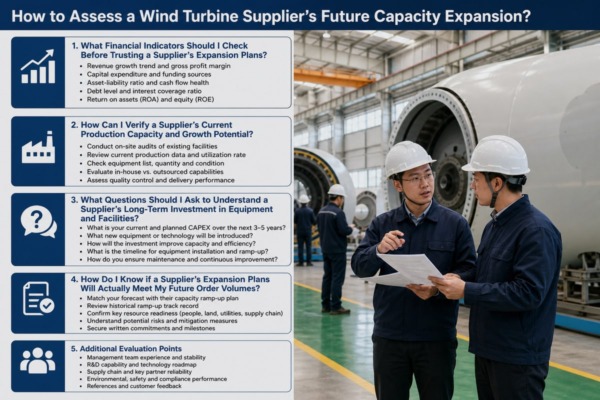
Financial liquidity and balance sheet strength are the primary indicators of whether a supplier can sustain a capital-intensive factory build cycle 1. In my own business, even a modest new production line ties up cash for months. A turbine factory ties up cash for years. WindEurope reports that at least €4 billion has been invested in new European manufacturing facilities 2 since 2022, plus at least €1.2 billion in expansions. That number tells you two things. First, expansion is already happening. Second, it is expensive, and only financially healthy suppliers can keep pace.
Core Financial Indicators to Review
| Indicator | What It Tells You | Warning Sign |
|---|---|---|
| Cash and liquidity | Ability to survive a multi-year build cycle | Cash reserves shrinking each quarter |
| Debt-to-equity ratio | How much expansion depends on borrowing | Rising debt with no new revenue |
| Free cash flow | Whether operations fund growth internally | Negative cash flow for several years |
| Committed capex | Whether plans have real budgets attached | Announcements with no capex line item |
| Backlog coverage | Whether orders justify the new capacity | Backlog growing faster than investment |
Funded vs. Announced Expansion
I always separate funded projects from press releases. Look at capital expenditure trends over three to five years, not one headline. Then run a simple order backlog analysis: does the backlog support the new factory, and does the factory investment match the backlog? This pairing is the heart of vendor bankability. A supplier with strong orders but weak investment will disappoint you. A supplier with heavy investment but no anchor customers may cut corners later.
How Can I Verify a Supplier's Current Production Capacity and Growth Potential?
When buyers visit our Zhejiang workshop, I walk them past every die-cutting machine and assembly bench. Floor space and equipment tell the truth about expansion potential faster than any brochure.
Verify current production capacity by requesting output data per product line, auditing the factory footprint and equipment on site, comparing historical nameplate capacity against actual annual deliveries, and checking whether workshop space, tooling, and workforce can physically support the growth the supplier claims.
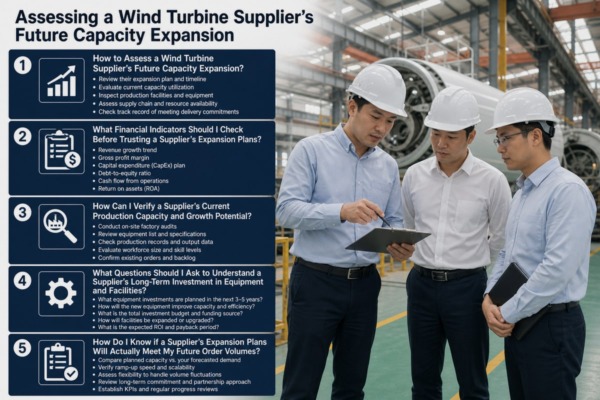
My core method is simple, and I apply it in my own factory every quarter: inspect the workshop scale and the equipment, judge whether the site can physically expand, and then test whether that capacity matches expected order growth. The same logic scales up to turbines. A supplier's OEM manufacturing footprint matters more than its slogans.
Nameplate vs. Deliverable Capacity
Nameplate capacity is a theoretical maximum. Deliverable capacity is what actually ships. Rystad Energy estimated global wind turbine manufacturing capacity at about 166 GW in 2023, up around 8% from 2021, yet regional bottlenecks persisted. So ask for the ratio of historical nameplate capacity to actual annual delivery volume. That ratio reveals true execution capability. Labor shortages, component shortages, and ramp-up problems all push real output below the headline number.
Capacity also differs sharply by product line. EU data illustrates this well:
| Component | 2024 EU Capacity | 2030 Requirement |
|---|---|---|
| Nacelles | 36.2 GW | Above 42 GW |
| Blades | 30 GW | Above 42 GW |
| Towers | ~42 GW | Above 42 GW |
A supplier can look strong in nacelle assembly capacity and still be constrained in blades. Always check each subassembly.
What a Factory Walk Reveals
On site, count active lines versus idle floor space. Ask about production lead times per unit. Ask whether the supplier uses digital twin simulations to stress-test throughput before building, and whether its plants use modular factory architectures that can be replicated in new regions. These two practices signal serious, repeatable scaling, not one-off luck.
What Questions Should I Ask to Understand a Supplier's Long-Term Investment in Equipment and Facilities?
Every time we buy a new die-cutting press, I weigh payback against next season's forecast. Wind turbine suppliers face the same trade-off, just with molds costing millions instead of thousands.
Ask about committed tooling budgets, next-generation platform compatibility, workforce training programs, quality frameworks like APQP4Wind, port and vessel access for offshore delivery, and raw material sourcing strategy. Suppliers with concrete answers on equipment, facilities, and people are investing for the long term.
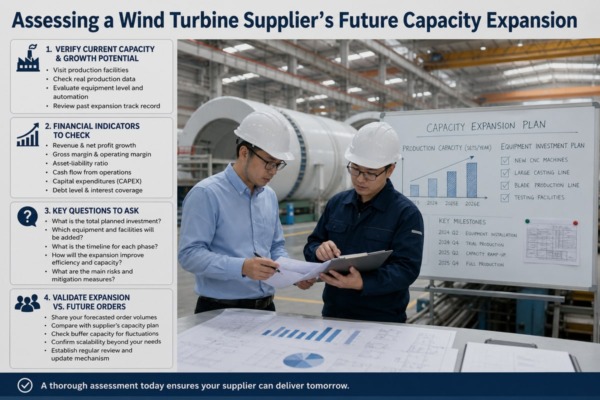
I have learned that vague answers about equipment are the loudest warning of all. In my factory, I can tell a buyer the age of every machine and when I plan to replace it. Expect the same clarity from a turbine supplier. Group your questions into three areas.
Equipment and Technology Questions
- What does your turbine technology roadmap look like for the next five years?
- Can your current tooling and molds support next-generation platforms, or will lines need full retooling?
- What certification progress exists for larger turbine classes? This matters because Europe's capacity for the >12 MW class was under 2 GW, far below expected demand for 2026 and 2030.
- Which announced facilities are permitted, under construction, or in trial production right now?
People and Quality Questions
- Do you run internal workforce development academies or technical partnerships to staff new plants?
- Do you follow the APQP4Wind quality assurance framework to protect component reliability during rapid scaling?
- How do you qualify new sub-suppliers as volume grows?
Logistics and Materials Questions
- For offshore wind logistics, do you have secured access to specialized ports and heavy-lift vessels? This is a non-negotiable bottleneck for offshore expansion.
- What is your vertical integration strategy? Direct equity stakes in rare earth processing or carbon fiber can insulate plans from commodity swings.
- How is raw material procurement hedged against price and supply volatility?
A supplier who answers all ten with specifics is investing for real. One who deflects is selling you a rendering.
How Do I Know if a Supplier's Expansion Plans Will Actually Meet My Future Order Volumes?
A holiday season taught me a hard lesson: we accepted orders our lines could not finish on time. Since then, I map every buyer's forecast against our real monthly throughput.
Map your projected order volumes against the supplier's expansion timeline, region by region. Confirm new capacity comes online before your delivery window, is located near your projects, matches the turbine sizes you plan to buy, and is backed by signed anchor customers.
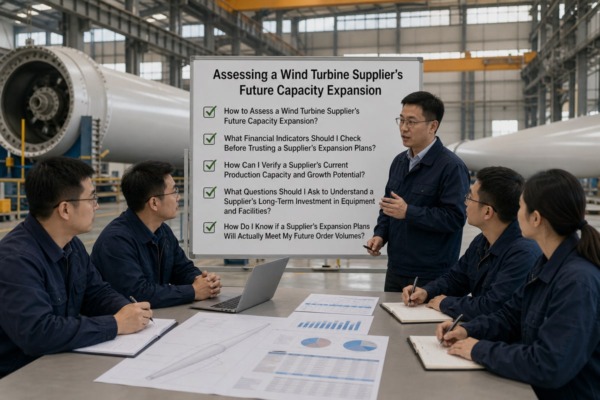
The demand side is not in doubt. IRENA says annual onshore wind additions 3 need to reach around 150 GW per year by 2030 and above 200 GW per year by 2050. Roland Berger argues Europe's offshore supply chain 4 must nearly triple, from 7 GW in 2023 to 20 GW by 2030. Some buyers conclude that in such a growth market, any credible supplier will scale in time. I disagree, and my own workshop taught me why. Announcements often outpace execution, because tooling, workforce, permitting, and supplier qualification all take longer than press releases suggest. Growth in the market does not guarantee growth in your supplier.
Match Timelines, Regions, and Product Mix
Build a simple alignment sheet. Put your delivery windows in one column and the supplier's commissioning dates in the next. Then check geography. Local content requirements in the US, Europe, and India can block imports or add cost, so capacity must sit where your projects sit. Geographic diversification of sub-component sourcing also strengthens supply chain resilience against tariffs and regional shocks.
Red Flags That Expansion Will Miss Your Window
| Red Flag | What It Usually Means |
|---|---|
| No site, timeline, or funding named | The plan is marketing, not engineering |
| Assembly grows but blades and towers do not | A hidden bottleneck will cap your deliveries |
| Backlog rises with no matching investment | Overselling against fixed capacity |
| No hiring or supplier onboarding evidence | The ramp-up will slip by quarters |
| Single-region, single-supplier dependence | One disruption stalls your entire order |
Finally, ask how much schedule slippage the supplier's plan can absorb before it breaks your delivery date. If they cannot answer, assume the worst and build a second source.
Conclusion
Capacity promises are cheap; funded factories are not. Verify finances, walk the floor, question equipment plans, and map timelines to your orders. That is how you protect your pipeline.
Footnotes
1. Global financial institution providing insights into capital-intensive industrial development and manufacturing investment cycles. ↩︎
2. Official industry body providing data on European wind energy investment and manufacturing growth. ↩︎
3. Intergovernmental organization providing global statistics and projections for renewable energy capacity. ↩︎
4. European Commission site covering trade and customs regulations affecting the renewable energy supply chain. ↩︎
More Articles
You might also find these helpful.
How to Remotely Verify a Factory's Production Capabilities for Wrought Iron Plug-In Components?
Learn how to verify a wind turbine supplier's true expansion capacity using financial audits, backlog analysis, and capex…
Read More →
How to Assess a Factory's Production Capacity When Sourcing Wrought Iron Inserts?
Learn how to verify a wind turbine supplier's true expansion capacity using financial audits, backlog analysis, and capex…
Read More →
What Questions Should You Ask Wrought Iron Insert Suppliers to Spot Unreliable Ones Early?
Learn how to verify a wind turbine supplier's true expansion capacity using financial audits, backlog analysis, and capex…
Read More → English
  Spanish
  German
  Arabic